
Select Data to Include in Reports
The Universal Selector allows teachers and administrators to select the test data they want included in the report they’re viewing and at what level. Using the Roster tab, teachers can easily move from focusing on a single student’s performance to seeing how multiple students or an entire class performed. With the Test tab, you can focus on one test, filter by test type, or look at all the tests taken so far that year. At the same time, the Date tab lets you filter student test results by custom or common date ranges.
If you're looking for a particular section about Creating Grouping Reports, use the links below to quickly move to that section:
Navigate the Roster Tab in the Universal Selector
Use the Roster Tab’s Data Filters
Navigate the Test Tab in the Universal Selector
Create a Custom Selection of Tests in the Test Tab
Filter Data by District Term Dates and Common Date Ranges
Filter Data by Custom Date Range
Filter Reports using Groups in Assessment Reports

|
Administrators can choose between schools. Teachers have their school pre-selected for them. |
Navigate the Roster Tab in the Universal Selector
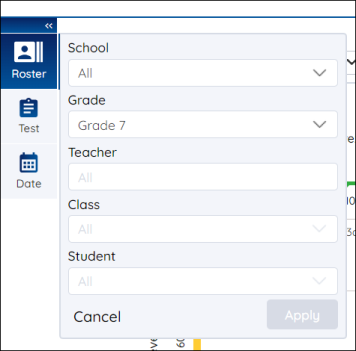
Select your report data from the Roster tab using the dropdown menus.
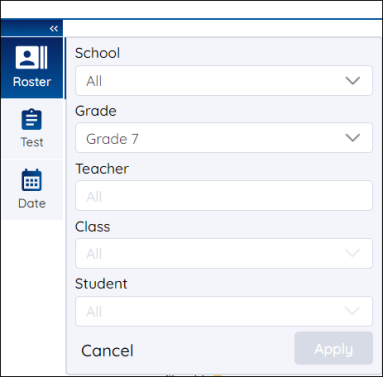
- School — select a school.
- Grade — select a grade.
- Teacher — select a teacher.
- Class — select a class.
- Student — select a student. The default option includes every student in the class.
After you’ve selected your data set press the Apply button. The Context Header will now display the data selected.
|
|
You can only navigate one tab at a time. Make sure to press the Apply button before moving to another tab. |
Use the Roster Tab’s Data Filters
You can filter test data by class and student. Administrators, depending on their role, can select other levels of report data, such as teacher, grade, and school.
- Access Reports.
- Click the Roster tab on the Universal Selector.
- Select a school from the School drop-down box. You can also enter the school name into the search bar.
- Select Grade from the Grade drop-down.
- Select a teacher from the Teacher drop-down box, or enter the teacher’s name into the search bar.
- Select a teacher from the Class drop-down box, or enter the class name into the search bar.
- Select a student from the Student drop-down box. The default is “All”. Locate a student by typing their name into the search bar, or by using the buttons and sorting arrows below the student list. After you've located the student, click the student's name.
- Click Apply.
|
|
The options displayed in the Universal Selector come from data derived from your student roster. Students can appear in the student drop-down box even when they have no associated assessment data. Including them in your report does not impact the displayed metrics. |
Using Student Data Filter
The Student Data filter displays all the classes a student is rostered for in your district. Using the Roster tab in the Universal Selector, you can select additional classes to include in the student level reports to view the student’s performance. The Student Data filter will only be available when a student is rostered to multiple classes in the district.
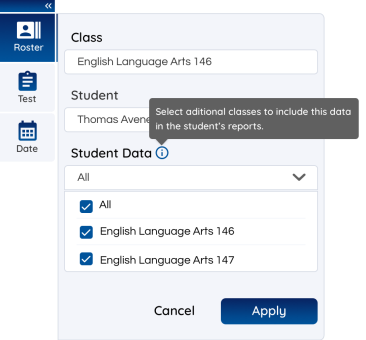
When multiple classes are selected, an info icon will appear by the Class name in the Context Header indicating the report includes student data from another class.
Navigate the Test Tab in the Universal Selector
Select your report data by using the Test tab.
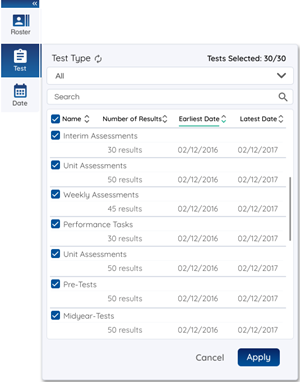
- Test type drop-down list — select the test types from which to draw report data. The default option is “all”, which includes all test types into your report. All boxes are checked by default. Click on a box to uncheck a test type. Click the box again to check it. Checking a test type brings it into your current data set.
- Search bar — Use the search bar to quickly find a specific test. Type the test name into the search bar to display it below.
- Selection boxes — Each box on the left refers to a single graded test. All boxes are checked by default; all graded tests are included in your report. Click on a box to uncheck a test. Click it again to check it. Checking a test brings it into your current data set.
|
|
Press the Apply button before moving to another tab. Checking or unchecking a test without pressing Apply excludes it from a report. |
- Sorting arrows in the header— Use the arrows to change the test display order.
- Name: Press the “up” arrow to display tests by name in alphabetical order. Press the “down” arrow to display the tests in reverse alphabetical order.
- Number of Results: Press the “up” arrow to order by tests with the largest number of test results first. Press the “down” arrow to order by tests with the least results available first.
- Earliest Date: Press the “up” arrow to order by tests with the earliest date of submission first. Press the “down” arrow to order by tests with the latest date of submission first.
- Latest Date: Press the “up” arrow to order by tests with the latest date of submission first. Press the “down” arrow to order by tests with the earliest date of submission first.
- Navigation buttons and arrows — use the buttons and arrows at the bottom to navigate when more than ten graded tests.
After you’ve selected your test data set press the Apply button. The Context Header will now display the data selected.

|
You can also quickly access the Test tab through the Context Header. Clicking on the area to the right of Tests: in the Context Header opens the Test tab. |
Create a Custom Selection of Tests in the Test Tab
You can create a custom selection of test data for your report by using the Test Tab.
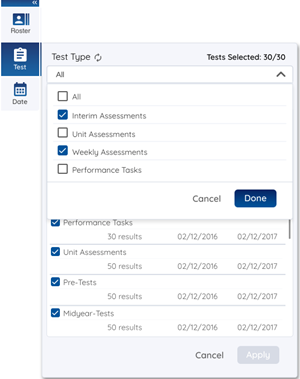
- Click the Test icon on Universal Selector
- Press the Test Type drop-down filter and deselect the test types that you want to remove from your report. Press the Done button.
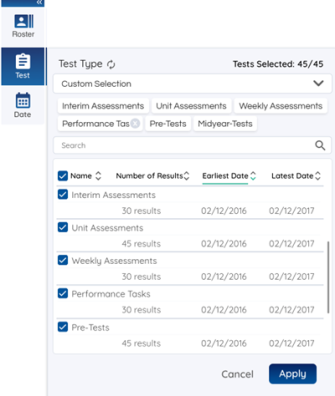
- Use the search bar to narrow down the selection of the tests displayed. Use the scroll bar on the right side of the test information box to navigate the tests. Deselect the tests you want to exclude from your custom report by unchecking the test selection boxes.
- Click Apply.
|
|
Remove test types from your report by pressing the (X) icon next to the name of the test type below the Test Type drop-down box. |
Filter Data by District Term Dates and Common Date Ranges
You can filter test data by their district terms and common date ranges by using the Date Tab.
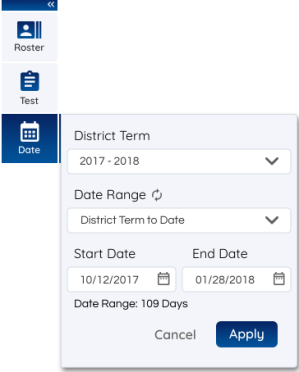
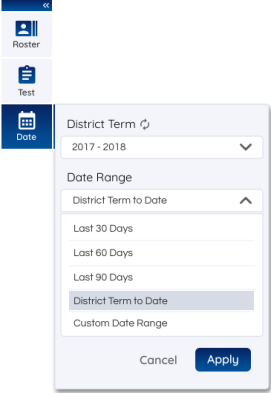
- Click the Date icon on the Universal Selector.
- Select a district term on the District Term drop-down menu.
- Select a date range from the Date Range drop-down menu. Date ranges include the Last 90 Days, District Term to Date, and others.
- Click Apply.
Filter Data by Custom Date Range
You can filter test data by their district terms and common date ranges by using the Date Tab.
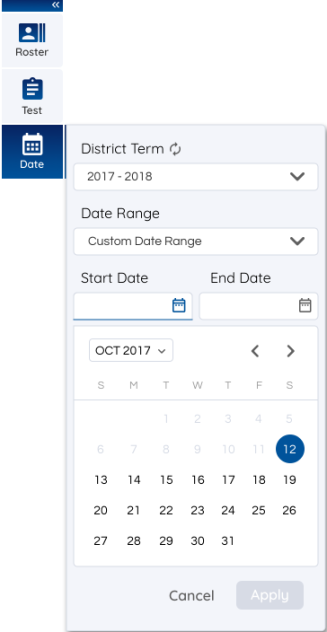
- Click the Date icon on the Universal Selector.
- Select a district term on the District Term drop-down menu.
- Select Custom Date Range from the Date Range drop-down menu.
- Use the drop-down month selector or arrow buttons in the Start Date drop-down menu to select the desired month and day. Select the desired date in the End Date drop-down menu.
- Click Apply.
|
|
Date ranges cannot exceed the span of a single district term. |
Filter Reports using Groups in Assessment Reports
You can Filter Reports using Groups in Assessment Reports by following the steps below:
- In the reporting application, users can use the saved groups functionality to filter and generate the reports for a certain subset of students.
- Teachers and Administrators can access the saved groups at the Class Level reports only.
- Teachers and Administrators can utilize the saved groups in Assessment Reports via the Universal Selector in the reporting application.
- To select a Group(s) in the Reports application, the users should navigate to the Roster tab in the Universal Selector
- From the Roster tab, a particular Class needs to be selected.
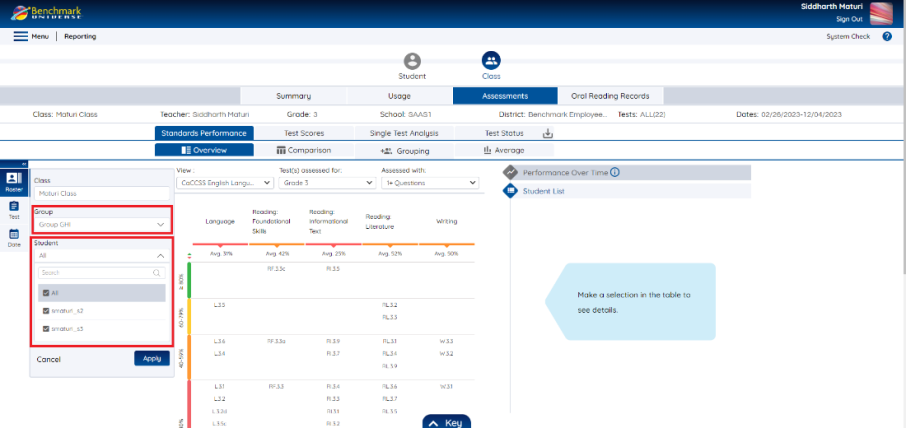
- Upon a class selection, a Groups dropdown will appear below the Class dropdown of the Roster Tab.
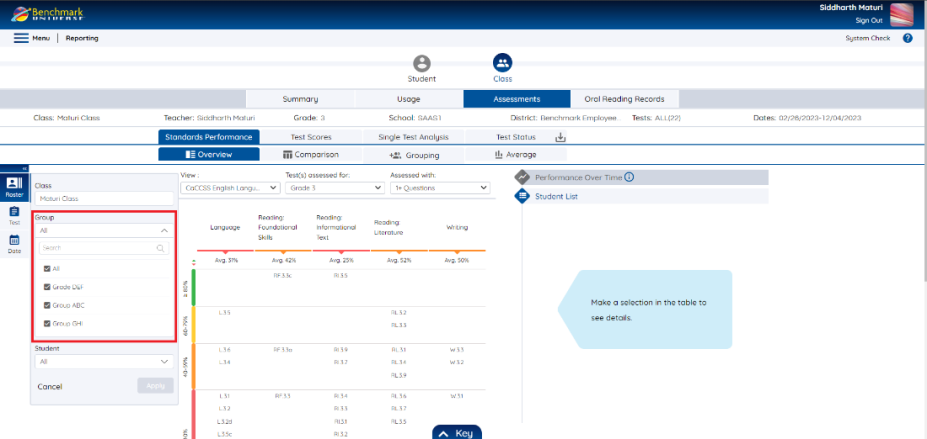
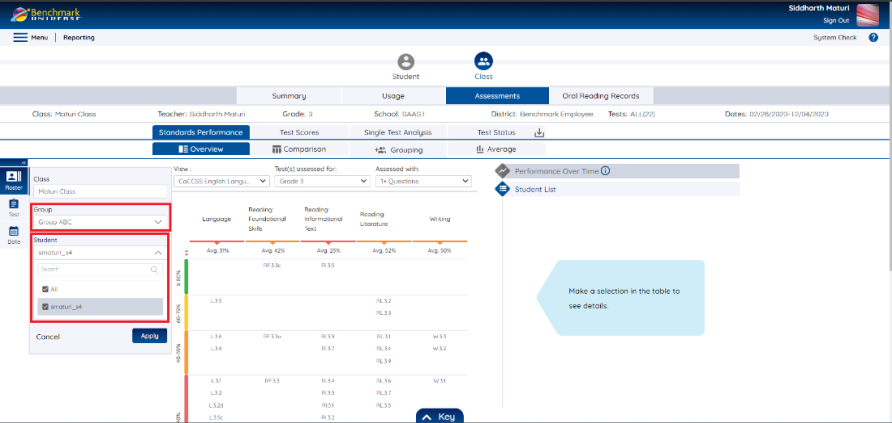
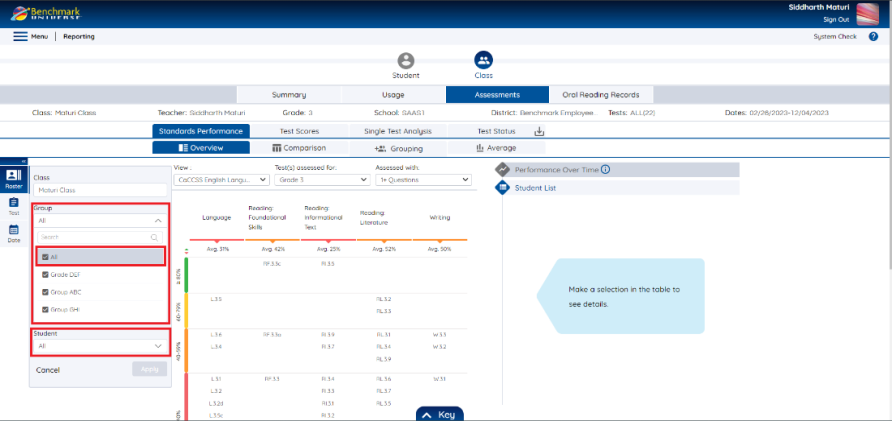
- Users can select All or custom select groups in the Groups dropdown. The Groups seen in the Group dropdown are a subset of the selected class only.
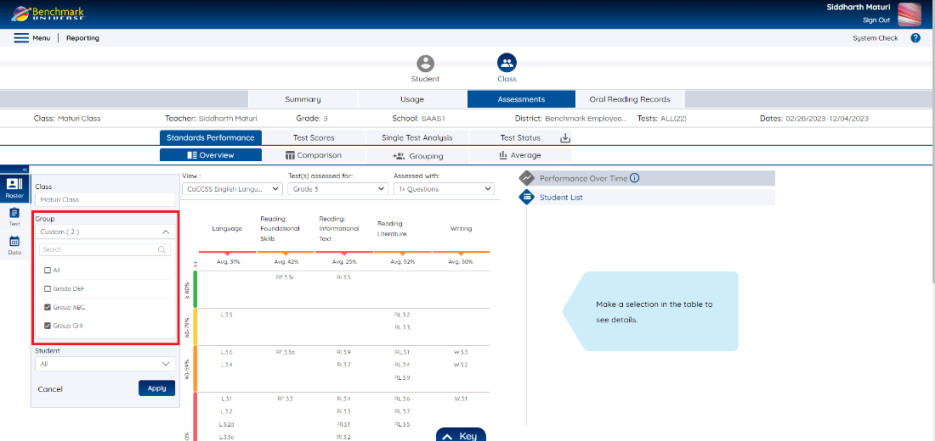
- The student dropdown in the Roster Tab will be populated based on the Groups selected. Only students in selected groups will be seen in the Students dropdown in the Universal Selector.
- Click Apply.
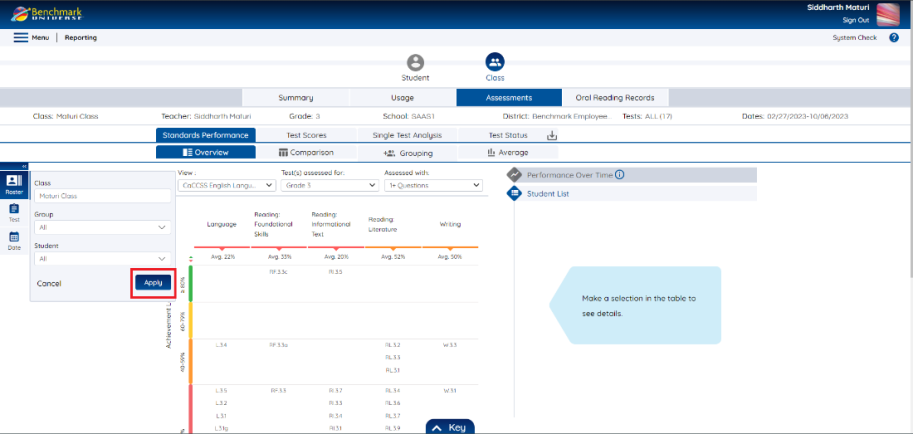
- The reports will be generated with the group(s) of students selected from the Universal Selector.
- Teachers and Administrators can custom select students from the students within the groups selected in the group's dropdown.
|
|
To select students that are not linked to any groups, the user should select "All" groups in the Groups dropdown. |
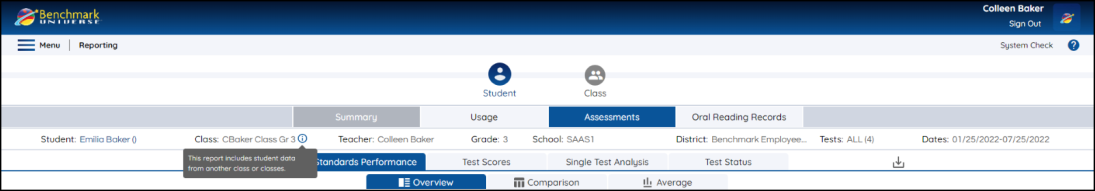
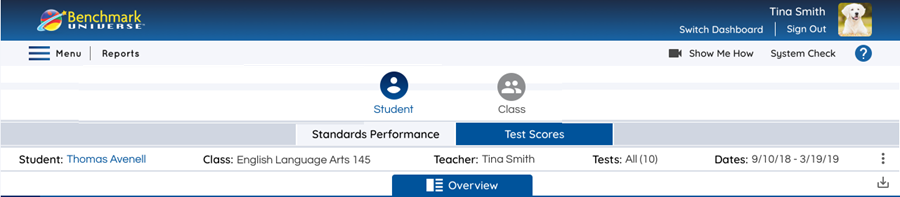
Reading the Context Header
The Context Header displays the data set of your current report. Using the Universal Selector, you can select data for the Context Header. This can include student, class, school, test, and date information. Using Apply in the Universal Selector modifies the Context Header.
If there is more information than can be displayed on the screen, an [...] icon appears. Click on the ellipsis to view the hidden information.
|
|
Clicking on a class, test, or school (for district administrators) in the Context Header opens the relevant tab in the Universal Selector. |
Last Updated: March 11, 2024